在 Redis Enterprise 中配置 Redis 查询引擎的查询性能因子
在 Redis Enterprise 中为 Redis 查询引擎配置查询性能因子,以提高查询性能。
| Redis 堆栈 |
|---|
查询性能因素旨在提高查询(包括向量搜索)的性能。启用后,它允许您通过为每个分片分配更多虚拟 CPU 来增加数据库的计算容量和查询吞吐量。这是对具有更多分片的水平扩展的补充,从而实现更高的键值作吞吐量。本文档介绍如何配置查询性能因素。
先决条件
Redis 查询引擎需要运行 Redis Enterprise Software 版本 7.4.2-54 或更高版本的集群。
如果您没有支持 Redis 查询引擎的集群,请在新集群上安装 Redis Enterprise Software 版本 7.4.2-54 或更高版本,或升级现有集群。
上浆
-
计算 Redis 数据库的硬件要求:
-
使用硬件要求文档来派生整体集群架构。
-
使用 Index Size Calculator 计算 RAM 要求。所需的总 RAM 是数据集和索引大小之和。
-
-
确定所需的查询性能因素和所需的 CPU 数量。未使用的 CPU(超过 Redis 所需的 20%)可用于可扩展的 Redis 查询引擎。
-
使用为查询性能因素配置的 CPU 数量创建新的 Redis 数据库。
计算查询性能因子
用于查询性能因素的 CPU
Redis 查询引擎的垂直扩展是通过为 RediSearch 模块预置额外的 CPU 来实现的。必须至少保留 20% 的可用 CPU 用于 Redis 内部处理。使用以下公式定义可分配给搜索的最大 CPU 数。
| 变量 | 价值 |
|---|---|
| 每个节点的 CPU 数 | x |
| Redis 内部结构 | 20% |
| Redis 查询引擎的可用 CPU | 地板(0.8 * x) |
查询性能因素与 CPU
下表显示了每个性能因素所需的 CPU 数量。此计算对搜索索引和查询的定义方式很敏感。某些方案产生的吞吐量可能低于下表中的比率。
| 比例因子 | Redis 查询引擎所需的最低 CPU 数量 |
|---|---|
| 无 (默认) | 1 |
| 2 | 3 |
| 4 | 6 |
| 6 | 9 |
| 8 | 12 |
| 10 | 15 |
| 12 | 18 |
| 14 | 21 |
| 16 | 24 |
性能系数计算示例
| 变量 | 价值 |
|---|---|
| 每个节点的 CPU 数 | 8 |
| 可用 CPU | floor(0.8 * 8)=6 |
| 比例因子 | 4 倍 |
| 缩放系数所需的最小 CPU 数 | 6 |
手动配置查询性能因子
要在 Redis Enterprise Software 中手动配置查询性能因素,请执行以下作:
-
在 Cluster Manager UI 中创建新数据库或编辑现有数据库的配置时,配置查询性能因子参数。
-
如果您为现有数据库配置查询性能因素,则还需要重新启动分片。新创建的数据库可以跳过此步骤。
在 Cluster Manager UI 中配置查询性能因子参数
在创建新数据库或编辑启用搜索的现有数据库时,您可以使用 Cluster Manager UI 配置查询性能因素。
-
在数据库配置屏幕的 Capabilities 部分中,单击 Parameters。
-
如果要创建新数据库,请选择 Search and query。
-
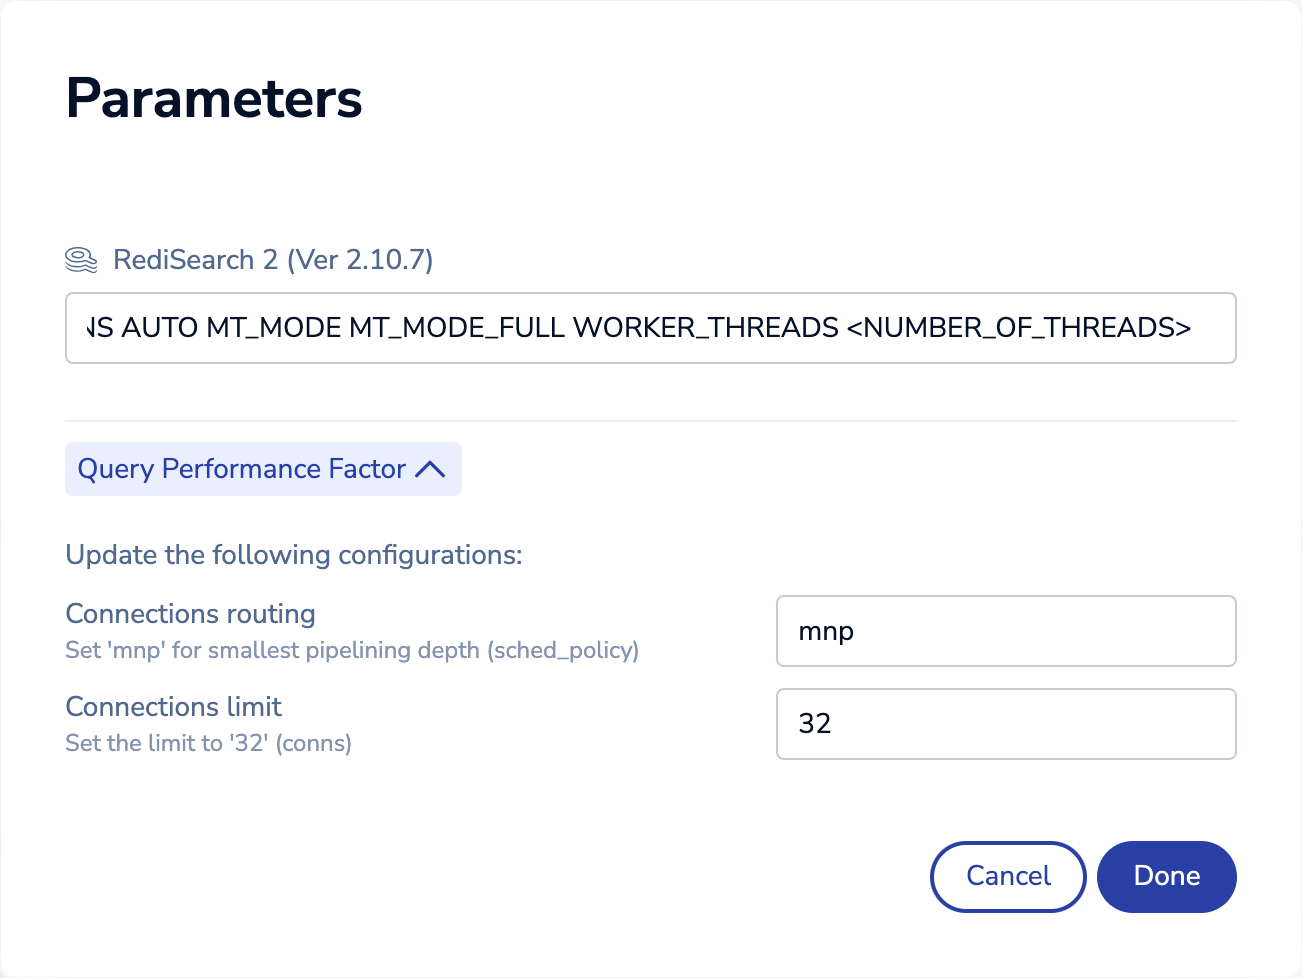
调整 RediSearch 参数以包括:
WORKERS <NUMBER_OF_THREADS>请参阅计算查询性能因子以确定用于
<NUMBER_OF_THREADS>. -
展开 Query Performance Factor 部分并输入以下值:
-
mnp用于 连接路由 -
32对于 Connections limit (连接限制)

-
-
单击 Done 关闭参数编辑器。
-
单击 Create 或 Save。
重启分片
更新现有数据库的查询性能因素后,重新启动所有分片以应用新设置。您可以迁移分片以重新启动它们。新创建的数据库可以跳过此步骤。
-
用
rladmin status shards db <db-name>要列出数据库的所有分片,请执行以下作:rladmin status shards db db-nameExample output:SHARDS: DB:ID NAME ID NODE ROLE SLOTS USED_MEMORY STATUS db:2 db-name redis:1 node:1 master 0-16383 1.95MB OK db:2 db-name redis:2 node:2 slave 0-16383 1.95MB OKNote the following fields for the next steps:ID: the Redis shard's ID.NODE: the node on which the shard currently resides.ROLE:masteris a primary shard;slaveis a replica shard.
-
For each replica shard, use
rladmin migrate shardto move it to a different node and restart it:rladmin migrate shard <shard_id> target_node <node_id> -
After you migrate the replica shards, migrate the original primary shards.
-
Rerun
rladmin status shards db <db-name>to verify the shards migrated to different nodes:rladmin status shards db db-nameExample output:SHARDS: DB:ID NAME ID NODE ROLE SLOTS USED_MEMORY STATUS db:2 db-name redis:1 node:2 master 0-16383 1.95MB OK db:2 db-name redis:2 node:1 slave 0-16383 1.95MB OK
Configure query performance factor with the REST API
You can configure the query performance factor when you create a new database or update an existing database using the Redis Enterprise Software REST API.
Create new database with the REST API
To create a database and configure the query performance factor, use the create database REST API endpoint with a BDB object that includes the following parameters:
{
"sched_policy": "mnp",
"conns": 32,
"module_list": [{
"module_name": "search",
"module_args": "MT_MODE MT_MODE_FULL WORKER_THREADS <NUMBER_OF_CPUS>"
}]
}
See Calculate performance factor to determine the value to use for <NUMBER_OF_CPUS>.
Example REST API request for a new database
The following JSON is an example request body used to create a new database with a 4x query performance factor configured:
{
"name": "scalable-search-db",
"type": "redis",
"memory_size": 10000000,
"port": 13000,
"authentication_redis_pass": "<your default db pwd>",
"proxy_policy": "all-master-shards",
"sched_policy": "mnp",
"conns": 32,
"sharding": true,
"shards_count": 3,
"shards_placement": "sparse",
"shard_key_regex": [{"regex": ".*\\{(?<tag>.*)\\}.*"}, {"regex": "(?<tag>.*)"}],
"replication": false,
"module_list": [{
"module_name": "search",
"module_args": "MT_MODE MT_MODE_FULL WORKER_THREADS 6"
}]
}
The following cURL request creates a new database from the JSON example:
curl -k -u "<user>:<password>" https://<host>:9443/v1/bdbs -H "Content-Type:application/json" -d @scalable-search-db.json
Update existing database with the REST API
To configure the query performance factor for an existing database, use the following REST API requests:
-
Update database configuration to modify the DMC proxy.
-
Upgrade module to set the search module’s query performance factor.
Note:
- Because this procedure also restarts the database shards, you should perform it during a maintenance period.
- This procedure overwrites any existing module configuration parameters.
The following example script uses both endpoints to configure a 4x query performance factor:
#!/bin/bash
export DB_ID=1
export CPU=6
export MODULE_ID=`curl -s -k -u "<user>:<password>" https://<host>:9443/v1/bdbs/$DB_ID | jq '.module_list[] | select(.module_name=="search").module_id' | tr -d '"'`
curl -o /dev/null -s -k -u "<user>:<password>" -X PUT https://<host>:9443/v1/bdbs/$DB_ID -H "Content-Type:application/json" -d '{
"sched_policy": "mnp",
"conns": 32
}'
sleep 1
curl -o /dev/null -s -k -u "<user>:<password>" https://<host>:9443/v1/bdbs/$DB_ID/modules/upgrade -H "Content-Type:application/json" -d '{
"modules": [
{
"module_name": "search",
"new_module_args": "MT_MODE MT_MODE_FULL WORKER_THREADS '$CPU'",
"current_module": "'$MODULE_ID'",
"new_module": "'$MODULE_ID'"
}
]
}'
Monitoring Redis Query Engine
To monitor a database with a query performance factor configured:
-
Integrate your Redis Enterprise deployment with Prometheus. See Prometheus and Grafana with Redis Enterprise for instructions.
-
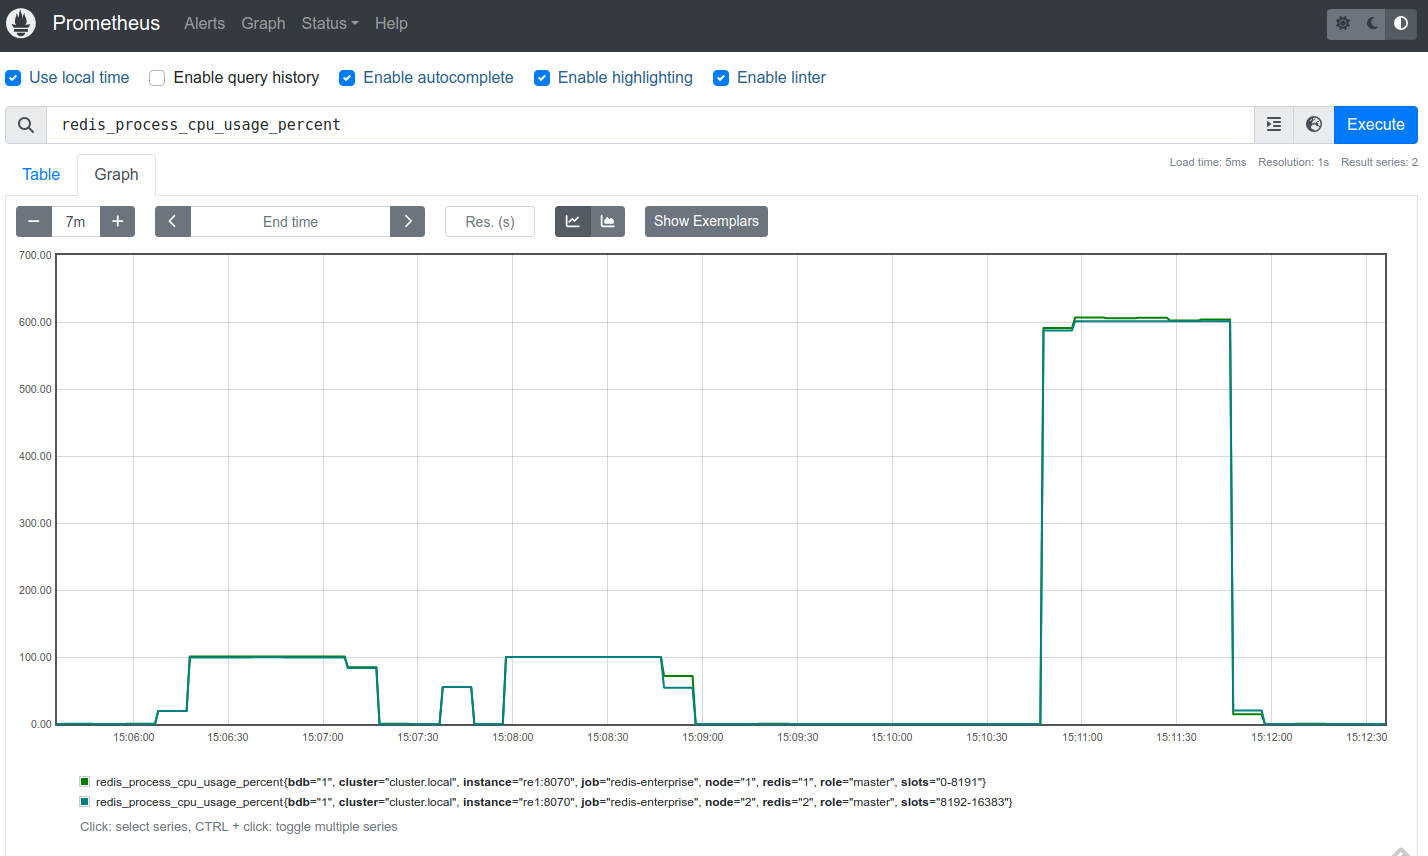
Monitor the redis_process_cpu_usage_percent shard metric.
The following Prometheus UI screenshot shows redis_process_cpu_usage_percent spikes for a database with two shards:
-
1st 100% spike: memtier_benchmark search test at the default (no additional CPUs for search).
-
2nd 100% spike: reconfiguration and shard restart for a 4x query performance factor.
-
3rd 600% spike: memtier_benchmark search test with threading at a 4x query performance factor (6 CPUs per shard).

On this page