Prometheus 和 Grafana 与 Redis Cloud
使用 Prometheus 和 Grafana 收集和可视化 Redis Cloud 指标。
您可以使用 Prometheus 和 Grafana 来收集和可视化 Redis Cloud 指标。
- Prometheus 是一个开源系统监控和警报工具包,可以从不同来源抓取指标。
- Grafana 是一个开源的指标可视化工具,可以处理 Prometheus 数据。
Redis Cloud 通过 Prometheus 终端节点公开其指标。您可以将 Prometheus 服务器配置为在端口 8070 上从 Redis Cloud 订阅中抓取指标。
Redis Cloud Prometheus 终端节点暴露在 Redis Cloud 的内部网络上。要访问此网络,请启用 VPC 对等连接或 Private Service Connect。这两个选项仅适用于 Redis Cloud Pro。您不能将 Prometheus 和 Grafana 与 Redis Cloud Essentials 一起使用。
有关 Prometheus 如何与 Redis Enterprise 集群通信的更多信息,请参阅 Prometheus 与 Redis Enterprise Software 的集成。
快速开始
您可以使用 Prometheus 和 Grafana Docker 镜像快速设置 Prometheus 和 Grafana 以进行测试。
先决条件
-
设置 VPC 对等连接。
-
将 Prometheus 终端节点从私有终端节点提取到您的数据库。私有终端节点位于数据库的 Configuration (配置) 选项卡下的 Redis Cloud 控制台中。Prometheus 终端节点位于内部服务器的端口 8070 上。
例如,如果您的私有终端节点是:
redis-12345.internal.<cluster_address>:12345The Prometheus endpoint is:internal.<cluster_address>:8070 -
Create an instance to run Prometheus and Grafana on the same cloud provider as your Redis Cloud subscription (for example, Amazon Web Services or Google Cloud). This instance must:
-
Exist in the same region as your Redis Cloud subscription.
-
Connect to the VPC subnet that is peered with your Redis Cloud subscription.
-
Allow outbound connections to port 8070, so that Prometheus can scrape the Redis Cloud server for data.
-
Allow inbound connections to port 9090 for Prometheus and port 3000 for Grafana.
-
Be located in one of the CIDR ranges of the RFC-1918 internal IP standard, which is comprised of three CIDR ranges:
- 10.0.0.0/8
- 172.16.0.0/12
- 192.168.0.0/16
The Prometheus endpoint is subject to a whitelist according to this standard.
-
Set up Prometheus
To get started with custom monitoring with Prometheus on Docker:
-
Create a directory on the Prometheus instance called prometheus and create a prometheus.yml file in that directory.
-
Add the following contents to prometheus.yml. Replace <prometheus_endpoint> with the Prometheus endpoint.
global:
scrape_interval: 15s
evaluation_interval: 15s
# Attach these labels to any time series or alerts when communicating with
# external systems (federation, remote storage, Alertmanager).
external_labels:
monitor: "prometheus-stack-monitor"
# Load and evaluate rules in this file every 'evaluation_interval' seconds.
#rule_files:
# - "first.rules"
# - "second.rules"
scrape_configs:
# scrape Prometheus itself
- job_name: prometheus
scrape_interval: 10s
scrape_timeout: 5s
static_configs:
- targets: ["localhost:9090"]
# scrape Redis Cloud
- job_name: redis-cloud
scrape_interval: 30s
scrape_timeout: 30s
metrics_path: / # For v2, use /v2
scheme: https
static_configs:
- targets: ["<prometheus_endpoint>:8070"]
-
Create a docker-compose.yml file with instructions to set up the Prometheus and Grafana Docker images.
version: '3'
services:
prometheus-server:
image: prom/prometheus
ports:
- 9090:9090
volumes:
- ./prometheus/prometheus.yml:/etc/prometheus/prometheus.yml
grafana-ui:
image: grafana/grafana
ports:
- 3000:3000
environment:
- GF_SECURITY_ADMIN_PASSWORD=secret
links:
- prometheus-server:prometheus
-
To start the containers, run:
$ docker compose up -d
-
To check that all the containers are up, run: docker ps
-
In your browser, sign in to Prometheus at http://localhost:9090 to make sure the server is running.
-
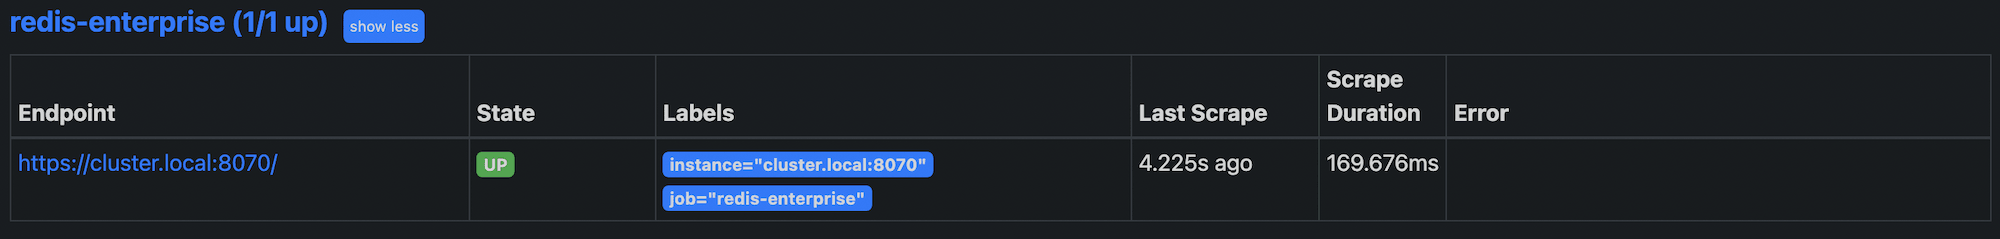
Select Status and then Targets to check that Prometheus is collecting data from the Redis Cloud cluster.

If Prometheus is connected to the cluster, you can type node_up in the Expression field on the Prometheus home page to see the cluster metrics.
See Prometheus Metrics for a list of metrics that Prometheus collects from Redis Enterprise clusters.
Set up Grafana
Once the Prometheus and Grafana Docker containers are running, and Prometheus is connected to your Redis Cloud subscription, you can set up your Grafana dashboards.
-
Sign in to Grafana. If you installed Grafana with Docker, go to http://localhost:3000 and sign in with:
- Username:
admin
- Password:
secret
-
In the Grafana configuration menu, select Data Sources.
-
Select Add data source.
-
Select Prometheus from the list of data source types.

-
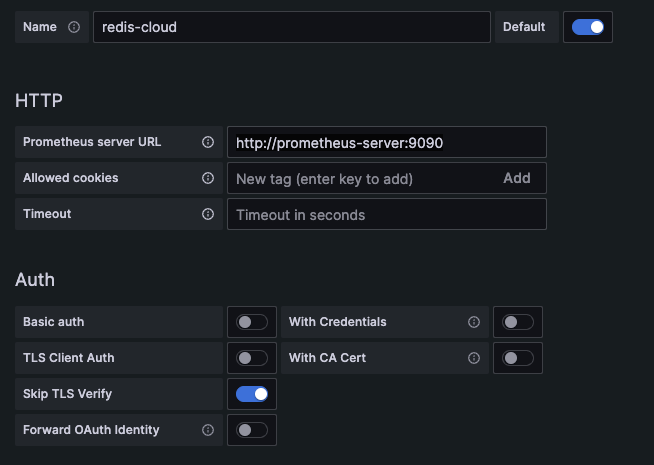
Enter the Prometheus configuration information:
- Name:
redis-cloud
- URL:
http://prometheus-server:9090
- Access:
Server
 Note:
Note:
- If the network port is not accessible to the Grafana server, select the Browser option from the Access menu.
- In a testing environment, you can select Skip TLS verification.
-
Add dashboards for your subscription and database metrics.
To add preconfigured dashboards:
- In the Grafana dashboards menu, select Manage.
- Select Import.
- Add the subscription status and database status dashboards.
Grafana dashboards for Redis Cloud
Redis publishes preconfigured dashboards for Redis Cloud and Grafana:
- The subscription status dashboard provides an overview of your Redis Cloud subscriptions.
- The database status dashboard displays specific database metrics, including latency, memory usage, ops/second, and key count.
- The Active-Active dashboard displays metrics specific to Active-Active databases.
These dashboards are open source. For additional dashboard options, or to file an issue, see the Redis Enterprise observability Github repository.
For more information about configuring Grafana dashboards, see the Grafana documentation.

On this page